|
Introduction
The
Bureau of Statistics (BOS) conducted the population and housing
census in April/May 2006. The census Preliminary results have
already been released in August 2007. The purpose of this report is
to provide the public with some tables on the final population size
by:
- District, age
group, and sex
- Constituency,
age group and sex
- Urban and rural
residence, age group and sex
The
distribution of the national, district and urban and rural
populations are also provided by single years of age.
Population size, age
and sex structure
The
final 2006 census results show that Lesotho’s de jure population is
1,876,633. This is marginally lower than the preliminary figure by
0.2 percent. Males constitute 912,798 which is 48.6 percent of the
total population, while females represent 963,835 or 51.4 percent.
This is consistent with the overall sex composition of the
population in the past censuses.
The
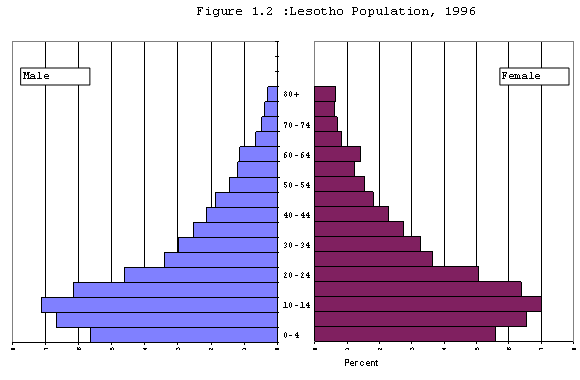
age and sex distribution is graphically presented in the pyramid in
Figure 1.1. It shows that in 2006, the age group 15-19 has the
highest percentage share (12.4) of the total population. In 1996, it
was age group 10-14 that had the highest percentage share (13) of
the total population.


Intercensal Growth
rate and Urbanization
The
implied annual growth rate of the population during the intercensal
period 1996-2006 is barely 0.08 percent. This represents a sharp
decline in the intercensal annual growth of 1.5 percent recorded for
the period 1986-1996. Detailed analysis of the dynamics of
population change would unravel the drivers of the observed rapid
decline in the population growth rate. The urban population in the
2006 census represents 22.8 percent of the total, compared with 16.9
percent in 1996. This translates to about 36 percent increase in the
urban population during the intercensal period.
The
percent distribution of the total population by district is
reasonably consistent with the trend over time. About one in every
five of the total population lives in Maseru while one in every
twenty-seven lives in Qacha’s Nek. The four largest Districts of
Maseru, Leribe, Berea and Mafeteng together hold about 62.2 percent
of the total population, a slight increase from 61.8 percent in
1996.
The
analytical report and the Statistical tables that will follow will
provide more details on the census results.
|